
Figure 2.
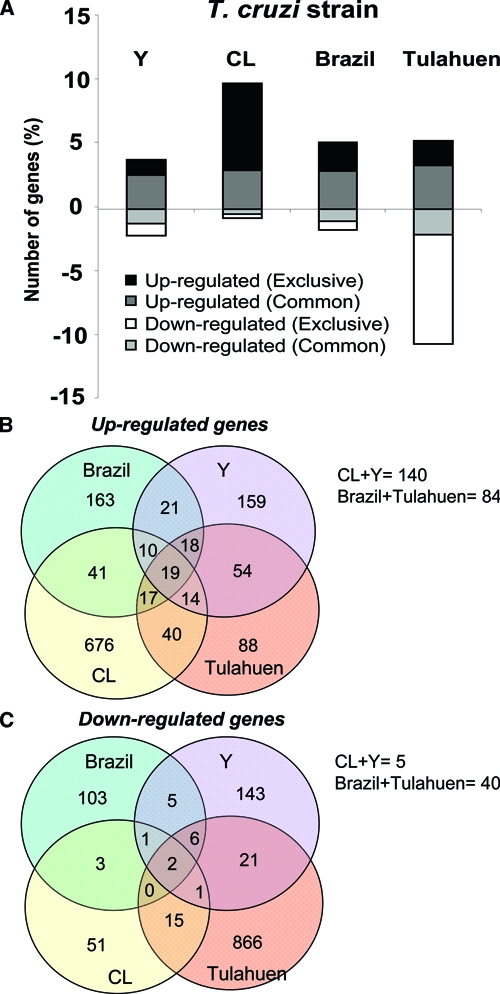
Profiles of transcriptomic changes caused by each strain of T. cruzi in host cells. The percentage of genes modulated in L6E9 cells by each T. cruzi strain is shown in A. Genes with fold-change value ³ 1.5 and P value ≤ 0.05 were quantified and plotted in this histogram, in which bars represent a percentage of the valid genes. Bars in white and black represent genes whose expression was decreased or increased exclusively by each strain, respectively. Bars in gray and light gray represent genes that were increased and decreased, respectively, and shared this modulation by at least two strains. The Venn diagrams represent the number of genes significantly (fold change ³ 1.5 and P value < 0.05) (B) increased and (C) decreased in common by all four strains, by three strains, by pairs of strains, and by individual strains of the parasite. The number of genes equally altered by CL + Y and Brazil + Tulahuen strains is indicated below the diagrams. Note the low number of genes altered in the same direction by all strains studied (19 increased and 2 decreased).