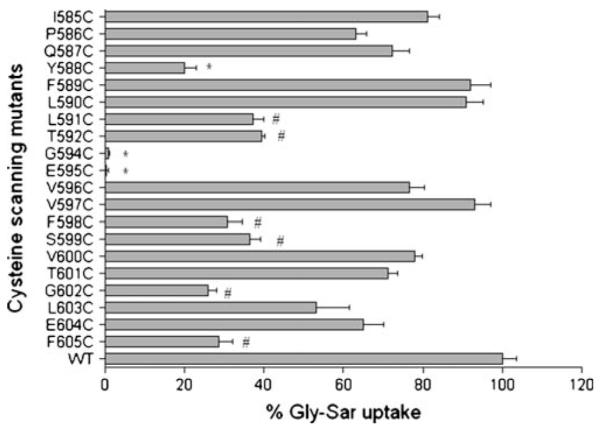
Fig. 2.

Percentage of Gly-Sar uptake activities of the cysteine-scanning mutants of TMD10 of hPEPT1. [3H]Gly-Sar uptake (0.5 μCi/ml, 10 min at 37°C) was measured 72 h post-transfection in HEK293 cells, individually transfected with cysteine-scanning mutants of TMD10 of hPEPT1. Results represent the % Gly-Sar uptake of each mutated transporter compared with WT-hPEPT1 (n=4–7). The background uptake values of mock-transfected HEK293 cells were subtracted. *, ≤ 20% specificactivity. #, 25–35% specificactivity.
