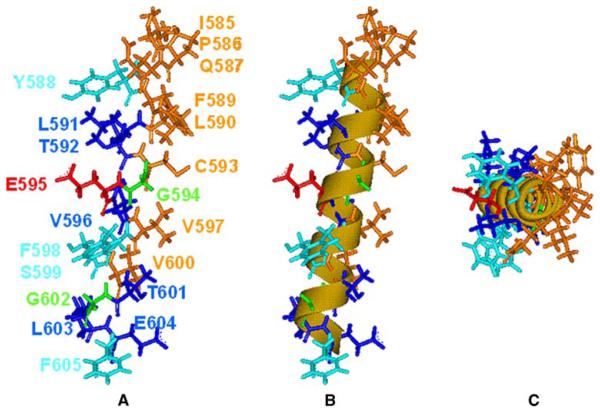
Fig. 7.
A model for TMD10 based on mutagenesis and cysteine modification data. A A linear alpha-helix with the N terminus (extracellular) at the top of the figure, colored based on MTSET-modification and mutagenesis data: eight residues (brown) (including endogenous C593) for which Gly-Sar uptake was unaffected by MTSET; six residues (blue) for which uptake was significantly reduced by MTSET; four residues (light blue) for which uptake was significantly reduced by mutation to cysteine; glycine residues (green); and E595 (red). B The same model showing that the data fit to a linear alpha-helix. C The model viewed down the helical axis. In all three images, the putative substrate translocation pathway is on the left.

