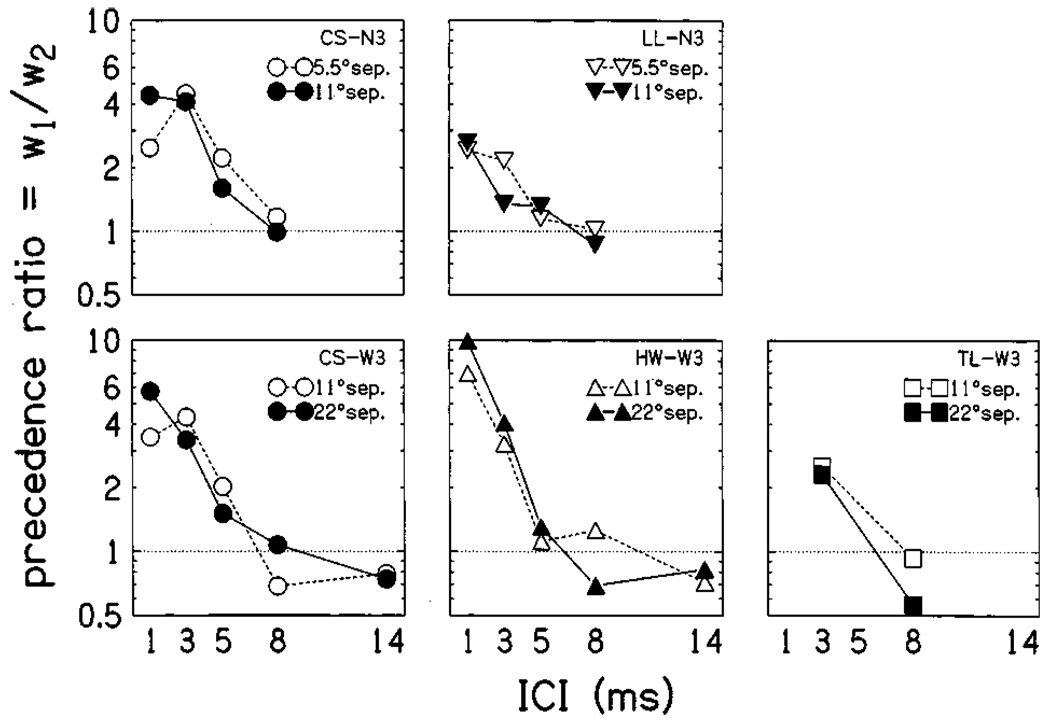
FIG. 4.
Precedence ratios for each subject, comparing trials separated by 5.5/11 and 11/22 deg. The precedence ratio of Eq. (5) is plotted as a function of ICI, separately for trials with different angular separations between click 1 and 2 (open versus filled symbols). Separate panels plot data obtained from individual subjects. Upper panels show ratios calculated under condition N3, lower panels plot ratios for condition W3. In all panels, dotted lines indicate the ratios that would be obtained if clicks were weighted equally (w1 = w2, pr=1).

