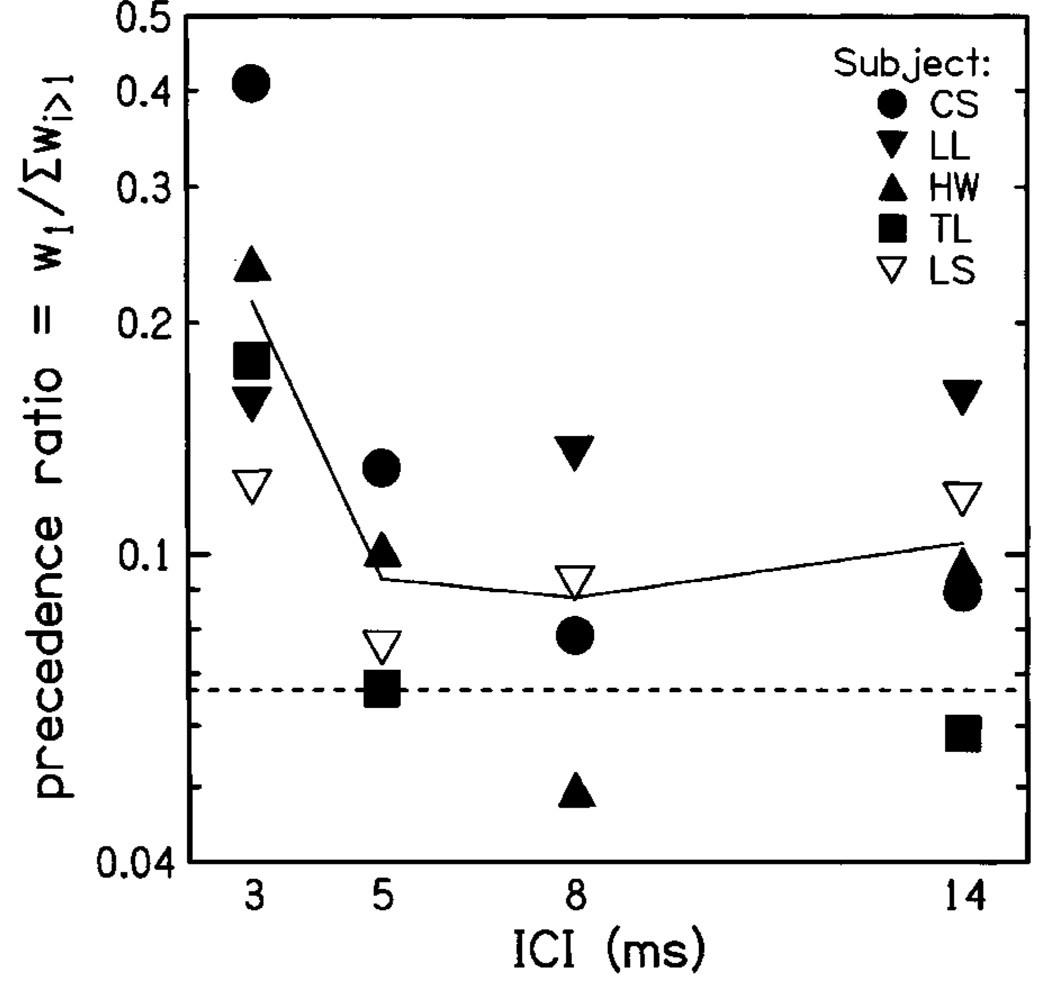
FIG. 6.
Precedence ratio for 16-click trains, plotted as a function of ICI. Ratios for individual subjects are indicated by symbol type; the solid line indicates mean ratio across subjects. The dotted line indicates the ratio that would be obtained if all clicks received equal weight. Two aspects of the figure should be noted: First, precedence ratios are largest for 3-ms ICI, and decrease as the ICI is extended. Second, the average ratio is slightly greater than 1, even for long ICIs, indicating that the onset has a somewhat stronger influence than later clicks even at slower rates.

