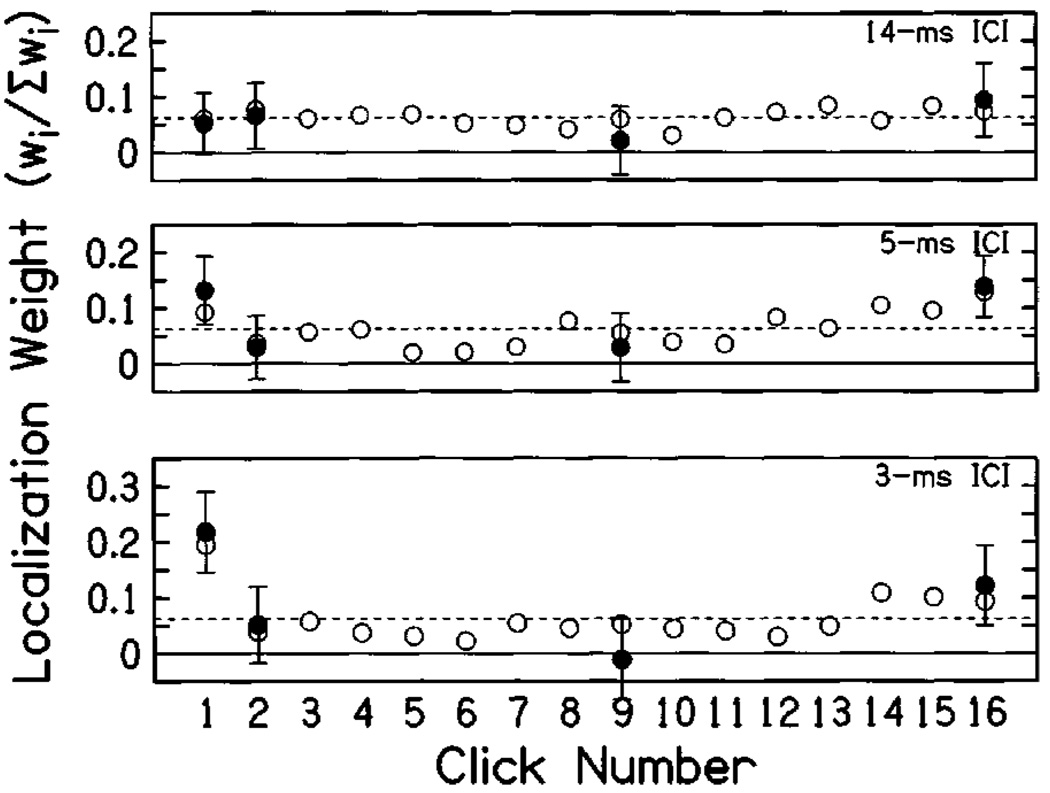
FIG. 8.
Mean normalized weights obtained using the probe method (experiment 4). Filled symbols indicate the normalized probe weight (see the text), plotted as a function of the probe position within a static train of 16 clicks. Error bars indicate 95% confidence intervals on probe weight estimates. Confidence intervals appear larger here than in experiments 1–3, partly because weights here were calculated using ≈ 200 trials each, as opposed to 400 trials in experiments 2 and 3. Open symbols plot the weighting functions obtained for 16-click trains in a control condition similar to experiment 2 but using the probe method’s loudspeaker configuration (w5). Confidence intervals for the control condition (not shown) were similar to experiment 2. Finally, dashed lines indicate values expected for equal weighting of all clicks.

