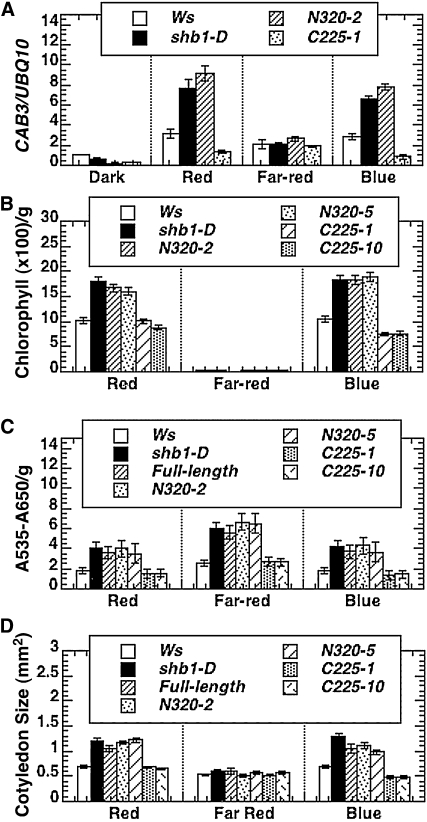
Figure 3.
Overexpression of the SPX and EXS Domains Affects Many Other Light Responses.
(A) Expression of CAB3 as assayed through real-time RT-PCR analysis. Total RNA was isolated from 5-d-old dark-grown seedlings without light treatment or treated with red, far-red, or blue light for 4 h. The expression levels of CAB3 were normalized to that of UBQ10.
(B) and (C) Quantification of the chlorophyll and anthocyanin (A535-A650) content, respectively, in 5-d-old Ws, shb1-D, and transgenic plants that express N320:GFP (lines 2 and 5) or C225:GFP (lines 1 and 10) under red, far-red, or blue light.
(D) Cotyledon size of 5-d-old Ws, shb1-D, and the transgenic plants that express full-length SHB1, N320:GFP (lines 2 and 5), or C225:GFP (lines 1 and 10) under red, far-red, or blue light. The light intensities were as indicated in Figure 1C. Data in (A) to (D) were presented as means plus or minus the se from three independent biological replicates.

