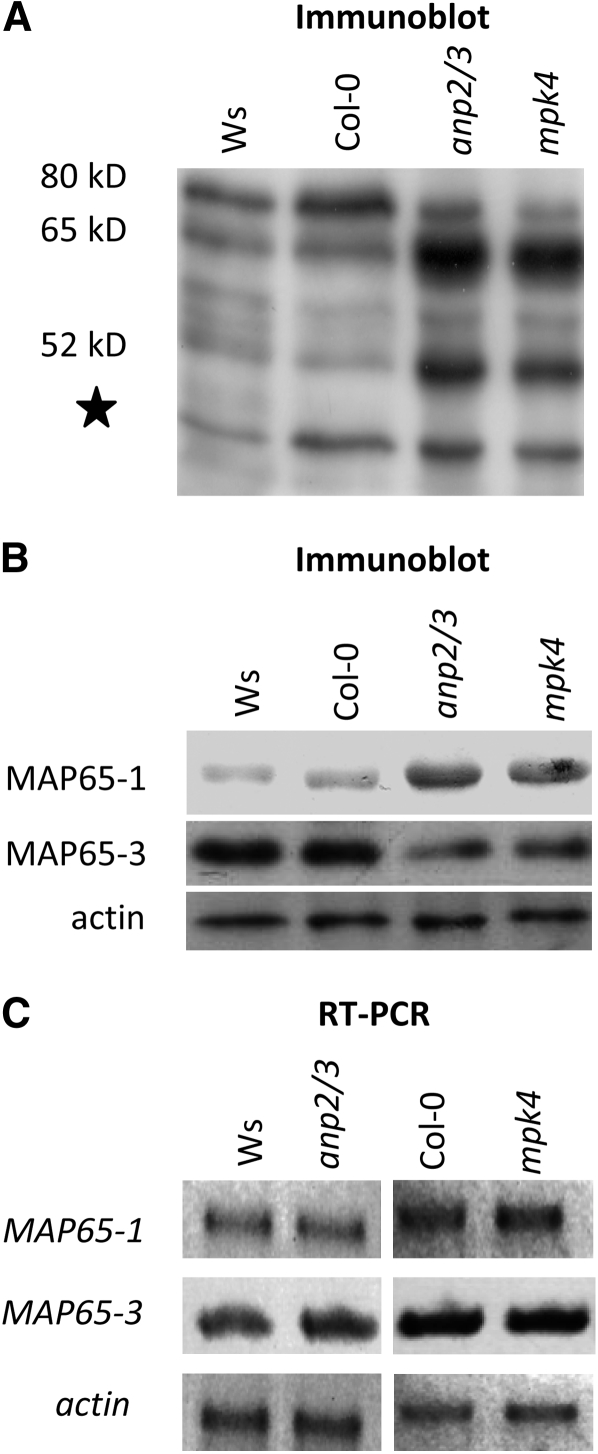
Figure 9.
Comparative Analysis of MAP65 Isoform Composition and Expression Levels.
(A) and (B) General immunoblot survey of MAP65 isoform composition detectable with an anti-CEEESWLEDYNR antibody (A) or with isoform-specific anti-MAP65-1 and anti-MAP65-3 antibodies (B) showing quantitative upregulation of the MAP65-1 and downregulation of the MAP65-3 in both the anp2 anp3 and the mpk4 mutants compared with the respective Ws and Col-0 controls. Numbers indicate molecular mass in kilodaltons. The star denotes a band probably corresponding to a degradation product of MAP65. Anti-actin staining was used as a loading control (B).
(C) RT-PCR analysis of MAP65-1 and MAP65-3 transcript levels (26 amplification cycles) showing no visible differences between Ws, anp2 anp3, Col-0, and mpk4 plants. ACTIN2 transcript (26 amplification cycles) was used as a loading control. Three biological and three technical replicates were performed.

