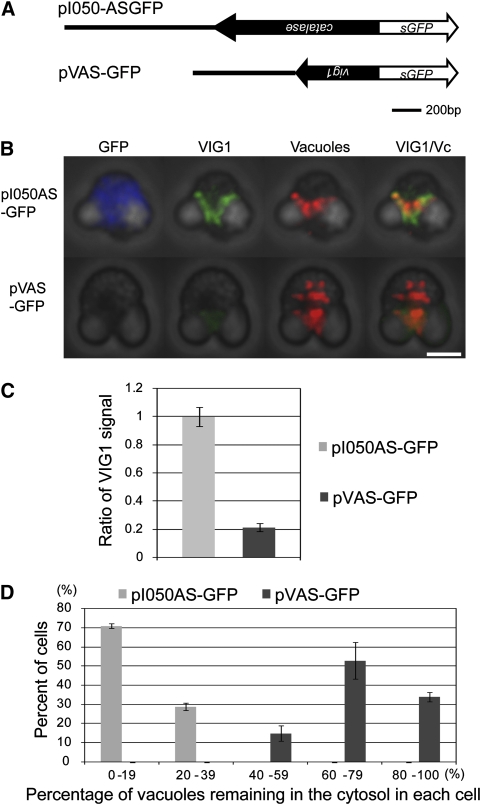
Figure 5.
Downregulation of VIG1 by AS RNA of vig1.
(A) Plasmids used in study. Black line represents the native promoter region of catalase and vig1. Closed arrow represents the antisense strand of catalase and vig1.Open arrow represents sGFP.
(B) Phase-contrast immunofluorescent image of transformants. Immunostained GFP, VIG1, and vacuoles are shown in blue, green, and red, respectively. In the pI050AS-GFP cell, VIG1 localized around vacuoles located in the mitochondrial region. In the pVAS-GFP cell, VIG1 signal decreased and vacuoles failed to localize in the mitochondrial region. Vc, vacuole. Bar = 2 μm.
(C) Ratio of VIG1 expression level between transformants. Signal intensity of immunostained VIG1 in the cytosol was measured. The signal intensity of each transformant was normalized by that in cells that were not transformed in each experiment. n = 20, number of cells examined. Bars indicate se.
(D) Index of the migration of vacuoles in transformants. The x axis shows categories based on the percentage of vacuoles remaining in the cytosol in each cell. The y axis shows percentage of cells falling in each category. In pI050AS-GFP cells (gray bars), most vacuoles did not remain in the cytosol and localized around the mitochondrial region. In pVAS-GFP cells (black bars), most vacuoles remained in the cytosol. pI050C: n = 30; pVAS-GFP: n = 25, number of mitotic cells examined. Bars indicate sd. This assay was performed in two biological repeats.

