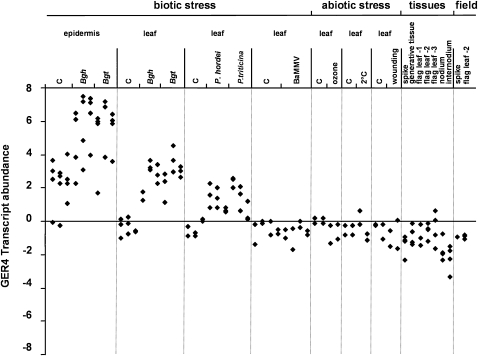
Figure 1.
Expression Profiling of the GER4 Gene Cluster.
The abundance of GER4 transcripts was studied in transcriptional profiling experiments following pathogen attack, during abiotic stress, and in different plant tissues. Normalized GER4 signal intensities were log2 transformed and median centered. Biological replicates are shown as stacks of symbols. For stress treatments where at least two time points were analyzed, symbol stacks were ordered from left to right according to increasing time. Bgh, B. graminis f. sp hordei; Bgt, B. graminis f. sp tritici (6, 12, and 24 h after inoculation). The leaf samples were split into epidermal tissue and remaining leaf (leaf). P. hordei and P. triticina: Whole-leaf samples were taken 12, 24, and 48 h after inoculation. BaMMV: Whole-leaf samples were tested from barley mild mosaic virus-infected, ELISA-positive plants 0, 3, 7, and 14 d after inoculation. Ozone: Whole-leaf samples were analyzed 36 and 96 h after application of ozone (190 ppb). Cold: Whole-leaf samples were assayed after 1 and 7 d of exposure to 2°C. Wounding: Whole-leaf samples were examined after 6 and 12 h. Mock-treated plants served as controls (C) for the biotic and abiotic stress treatments. Tissues from mature plants (yellow-to-white pollen stage) and samples from field-grown plants were collected as indicated.

