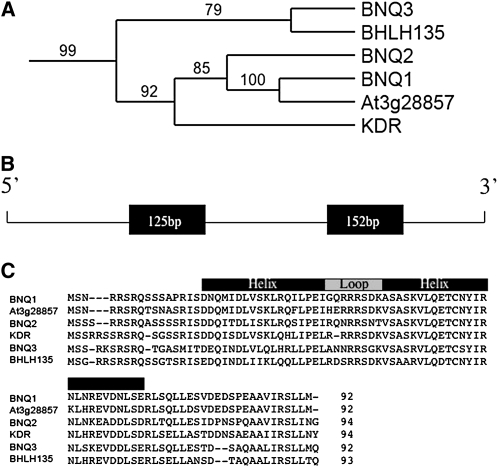
Figure 2.
Gene Structure and Amino Acid Sequences of BNQ Family Members.
(A) Neighbor-joining analysis of the BNQ subclade (see Supplemental Figure 1 online for complete analysis). Bootstrap values of 1000 replicates are shown.
(B) Gene structure of BNQ1. Black boxes represent the two exons.
(C) Alignment of amino acid sequences of BNQ related family members. The HLH domain is indicated by black and gray boxes.

