Figure 1.
Analysis of lkp2 and ztl lkp2 Clock Phenotypes.
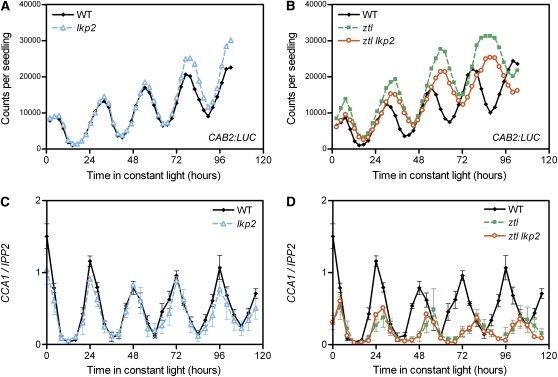
CAB2:LUC activity ([A] and [B]) and CCA1 expression ([C] and [D]) were analyzed in wild-type, lkp2, ztl, and ztl lkp2 plants in constant light (LL) conditions.
(A) and (B) CAB2:LUC traces represent the average of the results obtained for 36 seedlings of each genotype and are representative of three independent experiments.
(C) and (D) Normalized CCA1 expression level is the average (±se) of three independent biological replicates measured by real-time RT-PCR.
[See online article for color version of this figure.]

