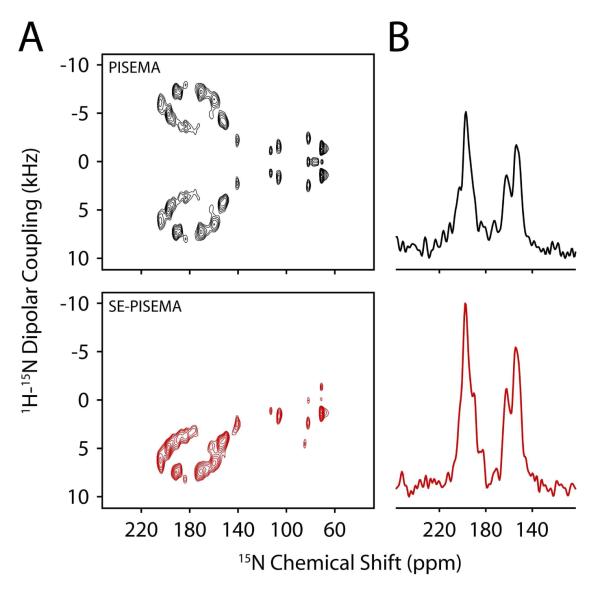
Figure 4.
(A) PISEMA (top) and SE-PISEMA (bottom) spectra of [U-15N] SLN in flipped bicelles. (B). 1D cross-section of panel A at 4.8 kHz DC. Each spectrum is recorded with 20 t1 increments and 2800 scans per increment. The τ value is set to 75 μs. The dipolar dimension is suitably scaled to compensate the theoretical scaling factors. The data is zero-filled to 8192 × 4096. A sine-bell window function is applied in F1 dimension and baseline correction is applied in F2 dimension.

