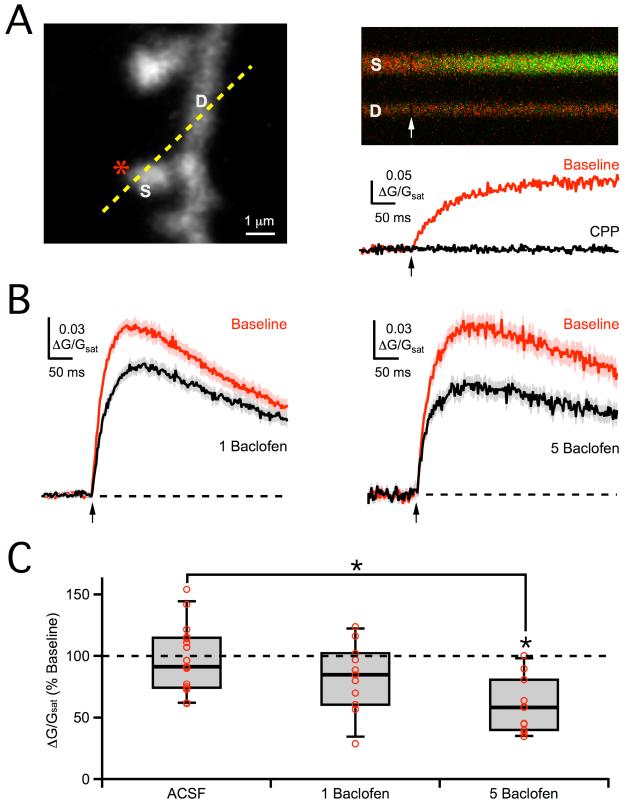
Figure 5. Postsynaptic modulation of NMDA-R Ca signals.
A, Left, 2PLSM image of dendrite (D) and spine (S), showing uncaging location (star) and line-scan position (dashed yellow line). Right, Line-scan through dendrite and spine (top) during 2PLU (arrows), with change in green Ca transient quantified as ΔG/Gsat (bottom), in baseline conditions (red) and following wash-in of CPP (black). B, Average 2PLU-evoked NMDA-R Ca signals in baseline conditions (red) and following wash-in of 1 μM baclofen (left, black) or 5 μM baclofen (right, black). C, Summary of changes in NMDA-R Ca signal amplitude following wash-in of 5 μM baclofen, 1 μM baclofen or ACSF. Asterisks indicate significant (P < 0.05) difference from 100% or between different conditions.

