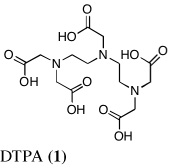
Table III.
Chelator-induced uranium excretion in non-bile duct-cannulated (intact) rats: Multiple dose chelator administration regimen a.
| Compound/Structure | n | Day | Urine U Excretionb (µg kg−1) |
Fecal U Excretionb (µg kg−1) |
Total U Excretion (µg kg−1) |
% Administered Dose Excreted |
Renal Conc. (µg g−1) |
Reduction (%) |
|---|---|---|---|---|---|---|---|---|
| Control: Uranyl Acetate 1 mg U kg−1 SC |
Day 1 | 295 ± 125 | 33 ± 14 | 328 ± 122 | 32.8 | |||
| 4 | Day 2 | 58 ± 8 | 32 ± 10 | 90 ± 3 | 9.0 | |||
| Day 3 | 34 ± 7 | 15 ± 5 | 49 ± 11 | 4.9 | ||||
| Day 4 | 17 ± 9 | 30 ± 16 | 47 ± 23 | 4.7 | 31 ± 6 | - | ||
 |
Day 1 | 380 ± 55 | 30 ± 19 | 410 ± 56 | 41.0 | |||
| 5 | Day 2 | 43 ± 11 | 13 ± 9 | 56 ± 16c | 5.6 | |||
| Day 3 | 29 ± 6 | 13 ± 5 | 42 ± 5 | 4.2 | ||||
| Day 4 | 14 ± 3 | 9 ± 5 | 23 ± 3 | 2.3 | 19 ± 2c | 39 | ||
 |
Day 1 | 205 ± 27 | 478 ± 181 | 683 ± 161d | 68.3 | |||
| 4 | Day 2 | 39 ± 5 | 116 ± 46 | 155 ± 48d | 15.5 | |||
| Day 3 | 23 ± 4 | 33 ± 4 | 56 ± 7 | 5.6 | ||||
| Day 4 | 11 ± 1 | 25 ± 2 | 36 ± 1 | 3.6 | 12 ± 2c | 62 | ||
Data are presented as the mean ± the standard error of the mean; n, number of animals; p-values were generated via a one-tailed student’s t-test.
Non-bile duct-cannulated (intact) rats were given uranium s.c. (left flank) at a dose of 1 mg U kg−1. The animals were given the chelators s.c. (right flank) at a dose of 300 µmol kg−1 immediately thereafter. Additional s.c. doses of DTPA or 9 were given at 24-h intervals for three more days (4 doses total).
Urine and feces were collected at 24-h intervals.
Mean is significantly less than control.
Mean is significantly greater than control.
