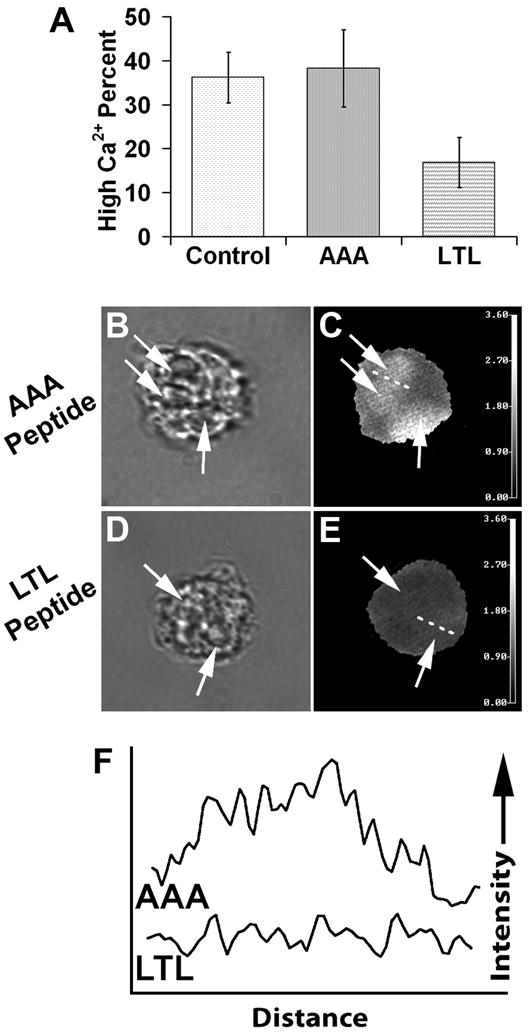
Fig. 5.

Trojan-LTL peptide treatment reduces Ca2+ signal intensity at the phagosome. Neutrophils were labeled with Indo-1 then treated with Trojan-AAA or -LTL peptides. Adherent cells were allowed to internalize EA, incubated an additional 2 hours, and then imaged as described in the Materials and Methods. Using ratio images, the Ca2+ signals of the cellular cytoplasm and phagosomes were evaluated for their relative Ca2+ ratios. For quantitative purposes, high Ca2+ ratio phagosomes were defined as those with a higher Ca2+ ratio in the phagosome than in the cell body, whereas phagosomes with equal or lower Ca2+ ratio than the cell body were considered to be low intensity. Panel A shows a quantification of the percentage of phagosomes (arrows) with high Ca2+ signals. Untreated control cells had high phagosome Ca2+ levels, similar to those in Trojan-AAA peptide-treated cells (A). When cells were treated with the Trojan-LTL peptide, a greatly reduced percentage of phagosomes exhibited high Ca2+ levels, in comparison to Trojan-AAA peptide-treated cells (p<0.0001). Panels B–E show examples of ratiometric Ca2+ images of cells treated with Trojan-AAA (B and C) and Trojan-LTL peptides (D and E). Phagosomes are denoted with arrows. High ratio phagosomes in C are evident in comparison to the low Ca2+ ratio phagosomes in E. Dashed lines through phagosomes in C and E show the line used for line profile analyses (F, traces AAA and LTL, respectively). The line profiles illustrate the higher Ca2+ ratios of the phagosome. (A, error bars representing standard deviation; B–E, x1000; B and C, n=5; D and E, n=4)
