
Fig. 8.
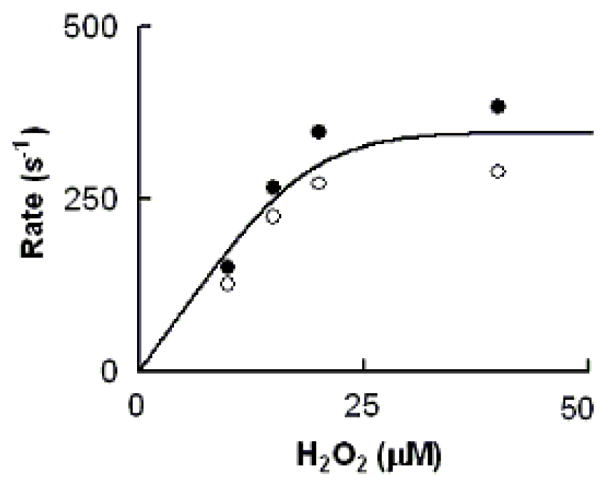
Rate of MPO-Fe(III) conversions to Compound II as a function of H2O2 concentration. The observed rate of MPO Compound II formation monitored at both 452 (close circles) and 432 nm (open circles) when a buffer solution containing 1.2 μM MPO, 400μM Trp, and 100 mM Cl− was rapidly mixed with a buffer solution supplemented with increasing H2O2 concentrations. Data represent the mean of triplicate determinations from an experiment performed three times.