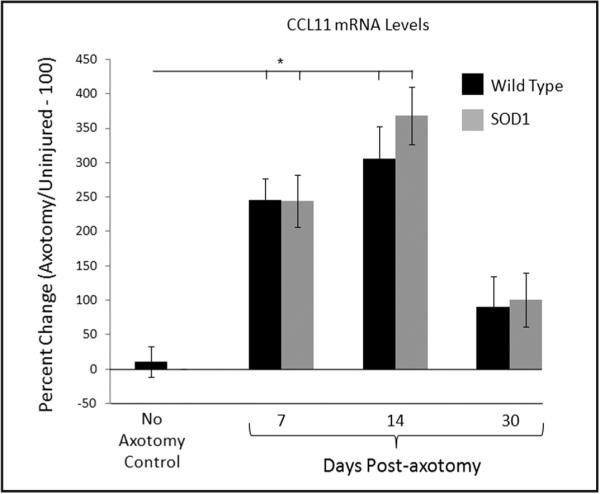
Figure 3.

CCL11 mRNA levels in control or axotomized WT (black bars) and presymptomatic mSOD1 (grey bars) mouse facial motor nucleus at 7, 14, and 30 days after facial nerve axotomy. Control CCL11 mRNA levels are displayed as the percent change between the right (axotomized) side and the left (uninjured) control side within each animal. At 7, 14, and 30 days post-axotomy, CCL11 mRNA levels are displayed as the percent change between the right (axotomized) side and the left (uninjured) control side within each animal. Bar heights represent means (±SEM). *Denotes significant differences at p ≤ 0.01.
