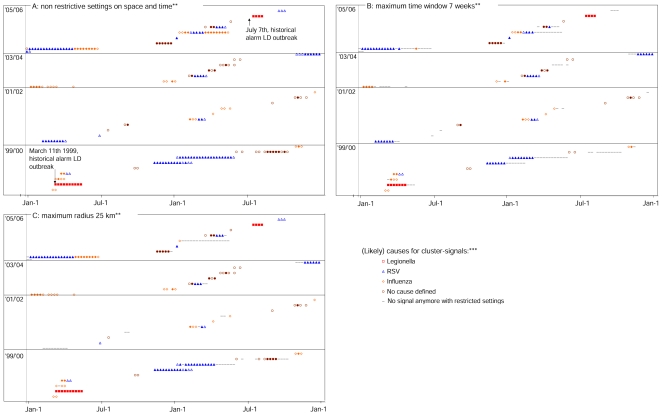
Figure 2. Clusters and generated cluster-signals on a timescale, including all (likely) causes (by weekly analysis).*.
*Clusters are indicated by sets of successive space-time overlapping cluster-signals placed next to each other on the same height on the y-axis. The cluster-signals caused by a data artifact in 2000 are not presented in the graphs. See Figure 1 for the criteria by which the likely causes were defined and see the Figure 2 legend for the graphic indication of likely causes. **In Figure 2a — for the analyses with non-restrictive settings on time and spatial windows — all detected clusters and signals are presented, as well as the (likely) causes according to the criteria in Figure 1. Figure 2b presents the signals and clusters that are still detected with a maximum time window of 7 weeks, and Figure 2c signals and clusters still detected with a maximum radius of 25 km. ***Signals indicated by open symbols (e.g. “○”) have a ≥1 year recurrence interval, coloured symbols (e.g. “•”) have a ≥5 yr recurrence interval. A recurrence interval reflects how often a signal of the observed significance level would be observed by chance [18]. I.e. if the recurrence interval of a signal is say 1 year, 1 signal of the observed significance is expected in 1 year.

