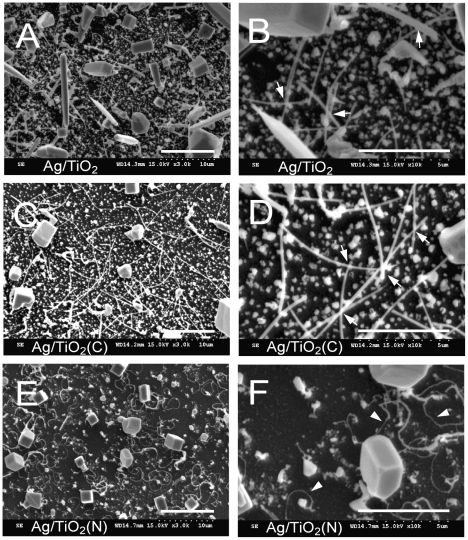
Figure 4. Scanning electron microscope images of Ag/TiO2 substrates.
TiO2 (A, B), TiO2 (C) (C, D) and TiO2 (N) (E, F) substrates were coated with silver (thermal reduced from 0.1 M AgNO3). Images with both low (A, C, E) and high (B, D, F) magnifications were shown. Arrows indicate the crossings of the rod-shaped silver nanoparticles (B, D); arrow heads indicate the wire-like silver nanoparticles (F). Scale bar: 10 µm (A, C, E), 5 µm (B, D, F).

