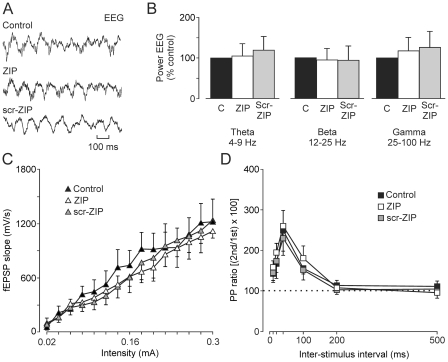
Figure 2. Effects on hippocampal EEG and on fEPSPs evoked at the CA3-CA1 synapse of ZIP and scr-ZIP injections in the CA1 area.
(A) Examples of EEG recordings carried out in representative control (C), ZIP-, and scr-ZIP-injected animals. (B) Spectral power analysis of EEG recordings collected from the three experimental groups indicated no significant differences (P = 0.809). (C) Input/output curves of the CA3-CA1 synapse collected from the three experimental groups (n = 5 animals per group). No significant differences (P = 0.874) were observed in the data collected from the three groups. (D) Results collected from the paired-pulse test applied to the three groups of animals. No significant differences (P = 0.978) between groups were observed. Drug infusions were carried out as indicated in the Methods section. Each bar in B and each point in C and D represents the mean value collected from 5 animals ± s.e.m.

