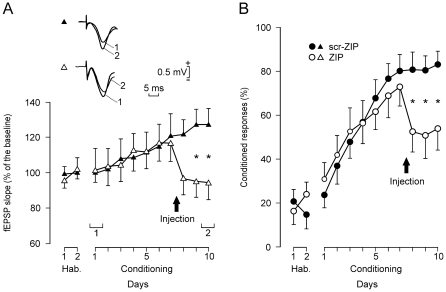
Figure 3. fEPSP and CR evolution for ZIP and scr-ZIP groups.
(A, B) fEPSP slopes (A, white triangles) and percentage of CRs (B, white circles) for ZIP-injected animals (n = 10). For comparison, data (A, fEPSP, black triangles; B, percentage of CRs, black circles) corresponding to the scr-ZIP-injected group (n = 10) are also illustrated. In both groups, the injection took place 2 h before the 8th conditioning session (arrow). Illustrated fEPSP recordings (A, inset) were collected from the 1st and the 10th conditioning sessions of representative ZIP and scr-ZIP animals. Data are indicated as mean ± s.e.m. Asterisks indicate significant differences observed between the two groups for both fEPSP slopes (P = 0.021) and the percentage of CRs across training (P = 0.004) following ZIP injection.

