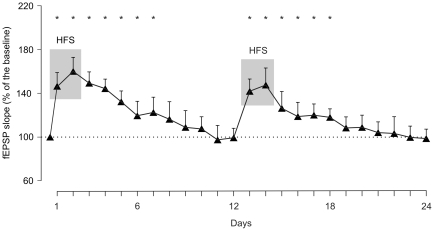
Figure 5. Characteristics of LTP evoked repetitively at the CA3-CA1 synapse.
LTP was evoked in a group of control mice (n = 10) by the presentation of two successive HFS sessions. Evoked fEPSPs reached values significantly larger than baseline recordings for the indicated days [asterisk, P≤0.05; F(24,96) = 3.950]. Subsequent HFS sessions were presented on days 13 and 14, i.e., after the first LTP has decayed to baseline values. Note that in this case, LTP was evoked again reaching values non-significantly different (P = 0.674) from those collected following the first two HFS sessions.

