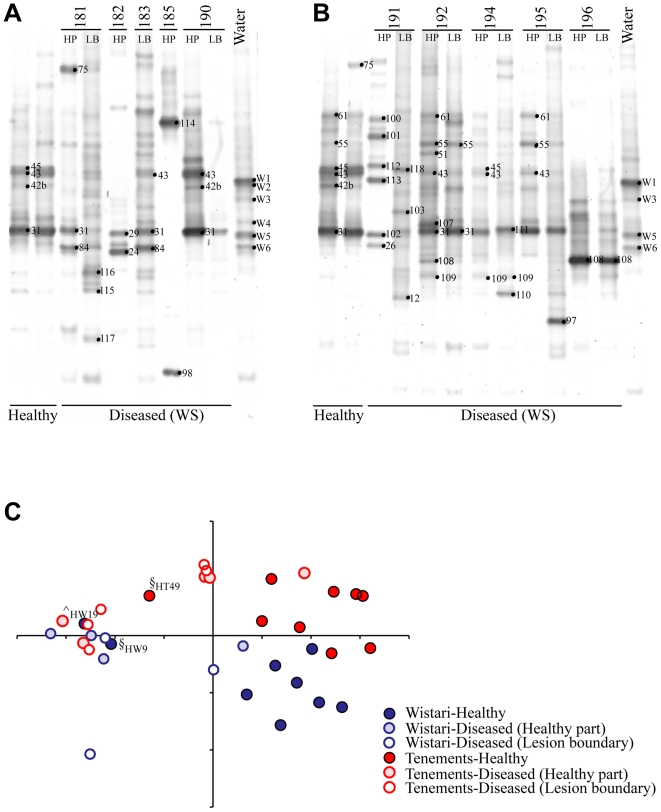
Figure 6. Denaturing gradient gel electrophoresis (DGGE) gels of healthy and diseased corals and water.
DGGE gels of the 16S rDNA hypervariable region V3 show the bacterial communities present in White Syndrome (WS) affected (diseased) Acropora hyacinthus colonies from (A) Wistari Reef and (B) Tenements. The most common healthy A. hyacinthus and water sample DGGE profiles at each site are included as a reference. Sample numbers are shown above each lane and band numbers indicate the position of bands excised for sequence analyses. HP = healthy part of diseased colony 10 cm away from the lesion boundary; LB = tissue from the border of lesion boundary of colony (see Methods for more information). (C) Principal components analyses (PCA) of the bacterial community diversity in apparently healthy and WS diseased A. hyacinthus. ∧ ,§ identify apparently healthy samples from Figure 2, which are more similar to ‘diseased’ (WS) samples than they are to other apparently healthy samples. Variation in the community structure explained by the first two PCA axes is 27.3%.

