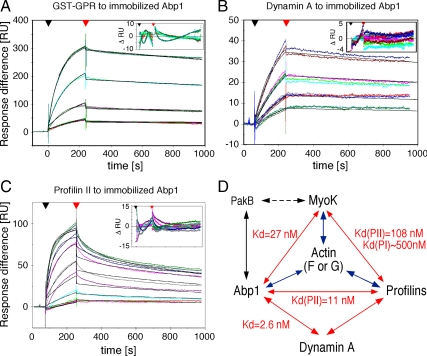
Figure 3.
SPR confirms and quantifies the direct interactions detected by blot overlays. (A–C) The affinity of the GPR loop (A), dynamin A (B), and profilin II (C) to immobilized GST-Abp1 were determined by SPR. A GST-coupled chip was used in the reference chamber. Experimental curves are in color, and fitted curves are in black. The range of concentrations of analytes used is indicated in Table 1. (D) Schematic representation of the protein-protein interaction network unraveled in this study. Arrows indicate direct interactions. When determined, equilibrium constants are indicated. Interactions with actin have been shown previously (blue arrows). A dashed arrow indicates indirect interaction identified by anti-Abp1 immunoprecipitation.

