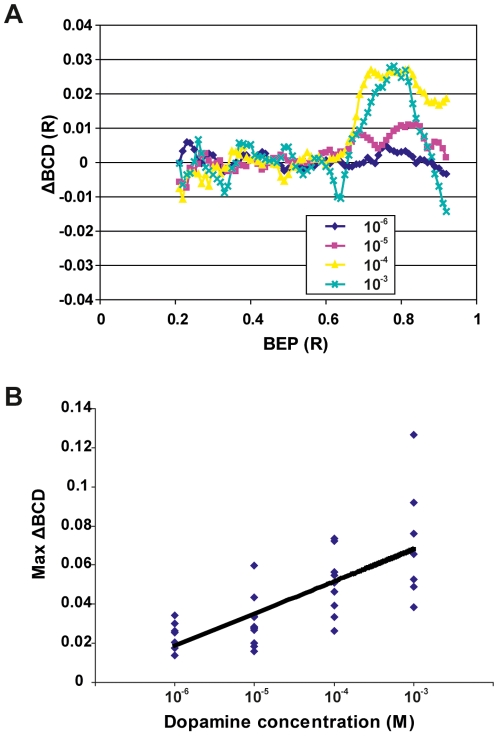
Figure 1. Dopamine decreases the refractive power in the lens periphery.
(A) The mean ΔBCD curves describe the difference between the treated and untreated lenses from all animals (see Methods and Materials). Positive ΔBCD values indicate a decrease in refractive power i.e. an increase in BCD in the treated lens compared with the corresponding control lens from the same animal. The curves are truncated at 0.2 lens radius (R) and 0.95 R because the scanning method has low accuracy close to the optical axis and in the outer periphery of the lens [30]. These regions contribute little to the image because of a small effective aperture (central region) and reflection at the lens surface (peripheral region; [31]). Note from the mean ΔBCD curves that dopamine decreased the refractive power in the lens cortex, from 0.60 R and outward. The mean ΔBCD increased in BEP 0.60–0.95 R when treated with increasing concentrations of dopamine. The curves represent the mean ΔBCDs from 34 animals (10−6: n = 7, 10−5: n = 11, 10−4: n = 9, 10−3: n = 7). (B) Linear regression on max-ΔBCD as a function of dopamine concentration gave a slope with the r2 value 0.457 that differed significantly from 0. Max-ΔBCD is the largest difference in BCD between the control lens and the treated lens measured at BEP 0.55–0.95 R (n = 34).

