
Figure 1.
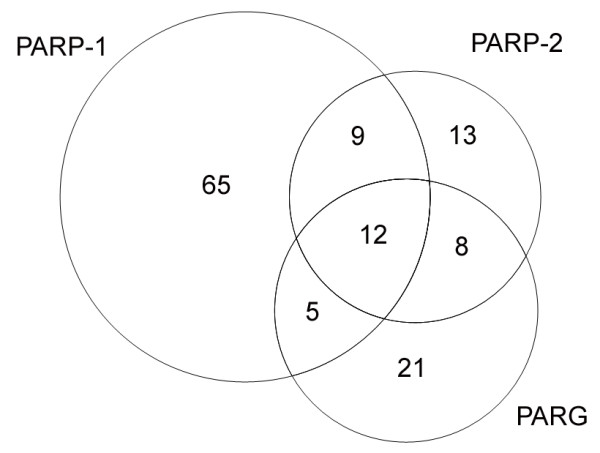
Venn diagram illustrating the number of interactors identified by AP-MS for PARP-1, PARP-2 and PARG. Numbers outside the overlaps correspond to proteins unique to either the PARP-1, PARP-2 or PARG immunoprecipitation dataset whereas numbers inside the overlaps correspond to proteins common to two or three datasets.