Figure 1.

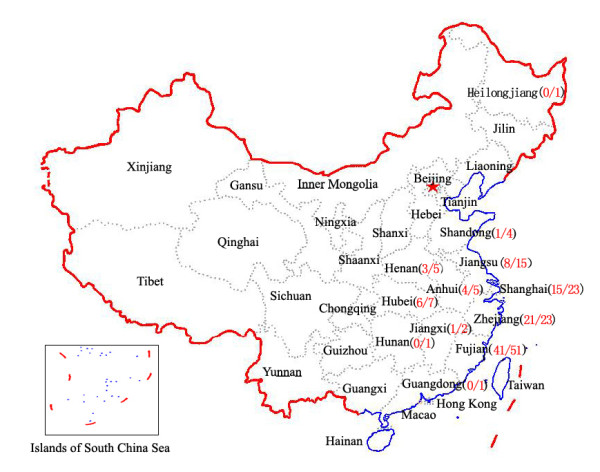
Distribution of the SCA families in the present study. The numbers in parentheses indicate numbers of MJD families/numbers of SCA families. (Reproduced with permission from http://nfgis.nsdi.gov.cn)

Distribution of the SCA families in the present study. The numbers in parentheses indicate numbers of MJD families/numbers of SCA families. (Reproduced with permission from http://nfgis.nsdi.gov.cn)