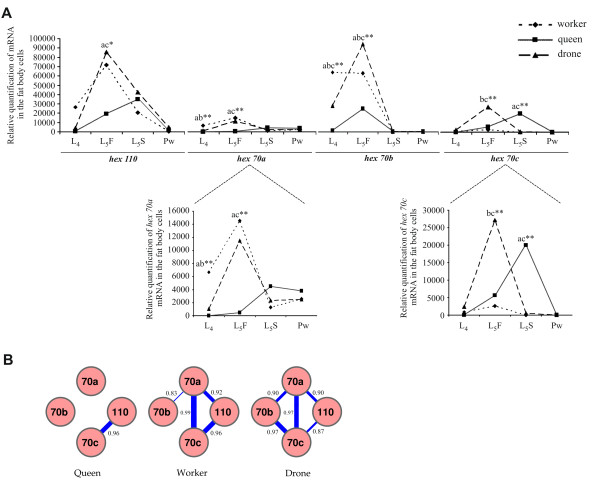
Figure 6.
Relative quantification of hexamerin transcripts in the larval and pupal fat body. (A) Levels of hex 70a, hex 70b, hex 70c and hex 110 mRNAs measured by real time RT-PCR in workers, queens and drones during the 4th larval instar (L4), the feeding (L5F) and spinning (L5S) phases of the 5th larval instar and in newly ecdysed pupae (Pw). All points in the curves represent means and standard errors of three biological samples each prepared twice (experimental replicates). For a better visualization of the data, the Y axis scale was extended in the graphs representing hex 70a and hex 70c expression. Letters indicate significant differences: (ab) workers ≠ queens/drones; (ac) queens ≠ workers/drones; (bc) drones ≠ workers/queens; (abc) workers ≠ queens ≠ drones. Statistical analysis was carried out with Jandel SigmaStat 3.1 software (Jandel Corporation, San Rafael, CA, USA), using two way ANOVA with post-hoc comparisons by the Holm-Sidak multiple comparison test. * p = 0.04, ** p ≤ 0.001. (B) Correlation among transcriptional profiles of the four honey bee hexamerin genes in queens, workers and drones during larval-pupal transition. The greater the thickness of the bar linking the encircled hexamerin genes, the higher the Pearson's correlation coefficient and association among expression profiles.

