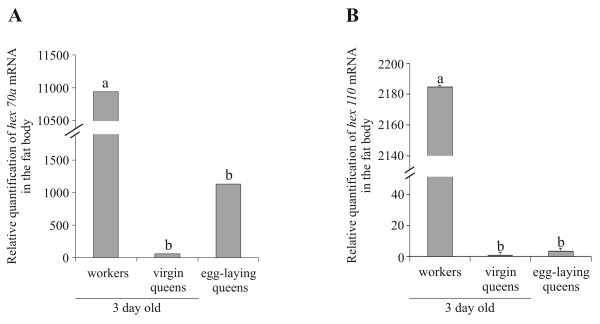
Figure 7.
Relative quantification of hexamerin transcripts in the fat body of adult females. Levels of (A) hex 70a and (B) hex 110 transcripts in 3-day-old workers and virgin queens, and in egg-laying queens. Different letters indicate significant differences between groups (p ≤ 0.001; one-way ANOVA with post-hoc comparisons by the Holm-Sidak test; SigmaStat 3.1 software; Jandel Corporation, San Rafael, CA, USA).

