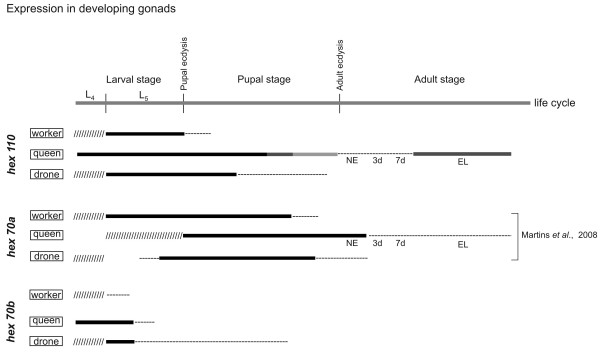
Figure 8.
Patterns of hexamerin genes expression in the gonads of immature and adult stages of workers, queens and drones. The simplified diagrams represent expression patterns based on the hexamerin transcript abundance as detected by RT-PCR followed by electrophoresis of the amplified cDNA on ethidium bromide-stained agarose gels using A. mellifera actin as a housekeeping gene (see Additional file 12). The black, dark-grey, light-grey and dashed lines in the diagrams represent high, intermediary, low and very low transcript levels, respectively. Data not shown are indicated (/////). L4 and L5: 4th and 5th larval instars. NE: newly emerged queens. EL: egg-laying queens. 3d and 7d: adult age in days. Data previously published by our laboratory are indicated by the respective bibliographic reference.

