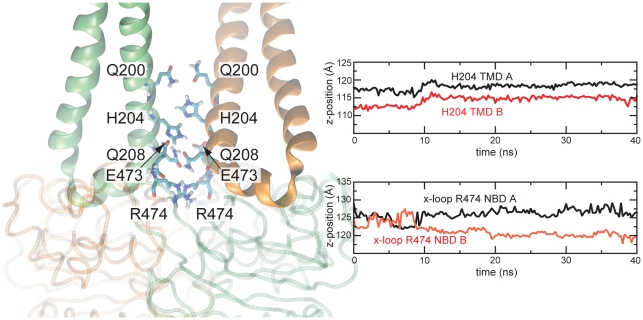
Figure 5. Initial asymmetry in the Sav1866 crystal structure.
Residue pairs along the Sav1866 symmetry axis, at the NBD-TMD interface, in a protonated form of the crystal structure. The CL2 loops of the TMDs are shown as green and orange ribbons. The NBDs are shown as transparent C-alpha traces. Exemplary plots of z-coordinates (along the bilayer normal) of the x-loop R474 and H204 in one of the repeat simulations indicate asymmetric stacking. See SI Figure S4 for similar plots in all simulations.

