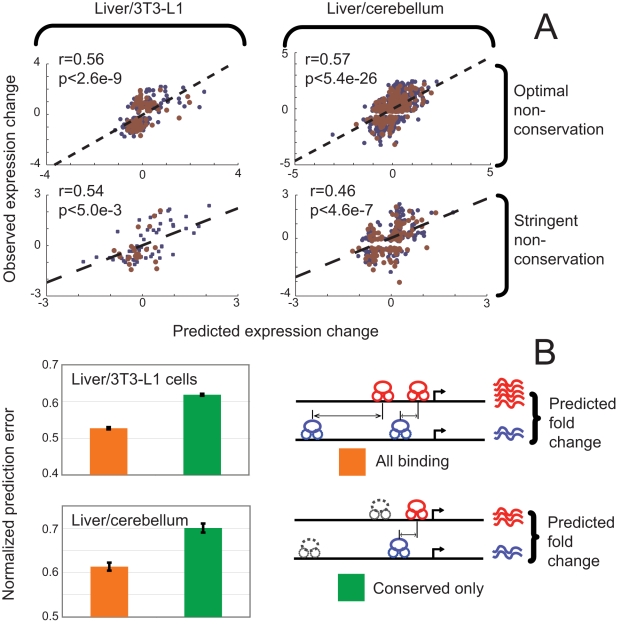
Figure 4. Non-conserved binding events predict expression.
(A) Scatter plots of observed and predicted expression difference are presented for differentially expressed genes bound only at non-conserved regions at stringent and moderate conservation thresholds. Training data points are shown in blue and test data is shown in red. Each non-conserved binding event's effect on transcription was modulated by its distance to the TSS. In both tissue pairs, and at both conservation thresholds, the model's predictions are strongly correlated with observed expression differences. (B) The expression difference of genes bound at both conserved and non-conserved sites was predicted using only conserved sites, and the prediction error was compared to that obtained when both conserved and non-conserved binding sites were used. Including non-conserved regions significantly improved performance in both tissue pairs. Error bars indicate +/− s.e.m.

