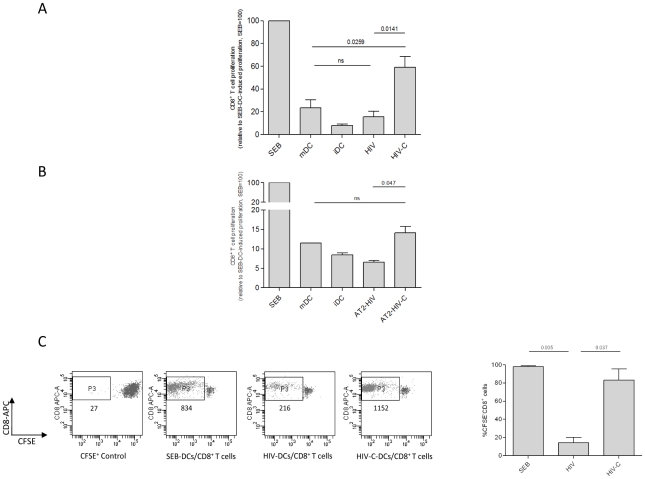
Figure 1. Proliferation of HIV-C-DC-primed CD8+ T cells.
Complement-opsonization of HIV (A) or AT2-inactivated HIV (B) and subsequent loading of DCs initiates proliferation of CD8+ T cells as measured by counting CD8+ T cells over a one minute period of time (A) and by CFSE-staining of CD8+ T cells (C). As positive control, DCs were exposed to the superantigen SEB, which induced strong proliferation of CD8+ T cells. The response to SEB was set at 100%. (A) No or low proliferation comparable to iDC-primed CD8+ T cells was mediated by DCs exposed to non-opsonized HIV (HIV). Cytokine-stimulated mDC-primed CD8+ T cells showed low proliferation, while HIV-C-exposed DCs induced about 60% proliferation compared to SEB-DC-primed CD8+ T cells. Columns represent mean values of CD8+ T cells from 5 donors stimulated with either BaL or 92UG037. Data were analyzed by unpaired Student's t-test. (B) Prime-boosting by AT2-HIV-C-loaded DCs caused proliferation of autologous CD8+ T cells, albeit weaker than with HIV-C-exposed DCs. In contrast, DCs loaded with AT2-HIV did not induce proliferation of CD8+ T cells at all. This was repeated four times with HIV strains 92BR030 or 92UG037. (C) Complement-mediated proliferation of CD8+ T cells was confirmed with 5 donors by staining cells with 2.5 µM CFSE prior addition of loaded DCs (n = 5). Left panel: dot plot of CD8+ T cells exposed three times to SEB-, HIV- or HIV-C-loaded DCs, and a CFSE+ control. The amount of cells in the live CD8high population (P3) is shown in the dot plot for one representative donor. Right panel: mean percentages of CFSE− [proliferated]/CD8+ T cells of SEB-, HIV- or HIV-C-DC-primed CD8+ T cells from 5 donors. Data were analyzed by unpaired Student's t-test.

