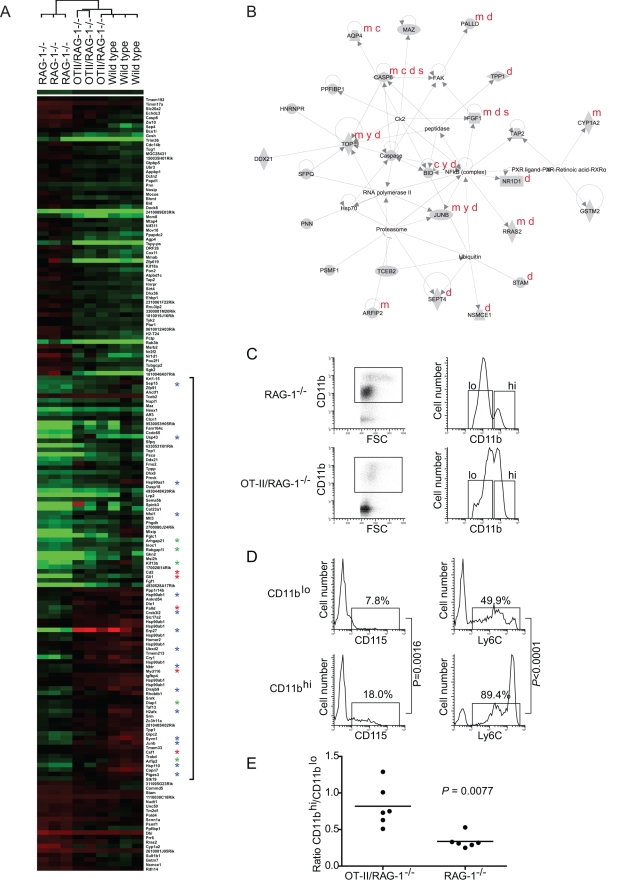
Figure 3. Modulation of gene expression in the liver by naïve CD4+ T cells.
(A) Microarray analysis revealed 165 genes that are expressed at statistically different (P<0.05) levels in liver tissue of both OT-II/RAG-1-/- and wild type mice compared to RAG-1-/- mice. Supervised hierarchical clusters of all 165 differentially expressed genes are shown. Red corresponds to overexpression and green to underexpression, compared to the pooled reference sample. Genes upregulated in OT-II/RAG-1-/- and wild type mice relative to RAG-1-/- mice are indicated by a bracket. Asterisks denote functional annotation as follows: red, myeloid cell development; blue, stress response; green, vesicle formation and transport. For a full list of differentially expressed genes, fold change in expression and statistical significance, see Table S1. Three animals of each genotype were used as a source of RNA for each array. Hybridizations were performed three times (i.e. nine arrays in total). (B) A representative network of functionally related genes from Figure 3A, algorithmically generated based on significant functional gene connectivity in the Ingenuity Pathways Knowledge Base. Network score = 45. Annotations in red denote genes associated with the five most significant biological functions listed in Table S2, as follows: m, Cell Morphology; c, Cellular Compromise; y, Cell Cycle; d, Cell Death; s, Cell-to-Cell Signaling and Interaction. (C) Flow cytometric analysis of peripheral CD11b+ mononuclear cells from representative RAG-1-/- (upper panels) and OT-II/RAG-1-/- (lower panels) mice. After excluding dead cells and granulocytes, mononuclear cells were selected based on CD11b positivity and forward scatter (gate, left panels). Cells in this gate resolved into two populations (hi and lo) based on CD11b expression levels (right panels). (D) Analysis of CD115 (left panels) and Ly6C (right panels) expression by CD11blo (upper panels) and CD11bhi (lower panels) cells defined by the gates in C, right panels. Gates indicate the percentage of gated cells expressing each marker. P values were calculated from analysis of 5 mice per group. (E) Relative abundance of CD11bhi and CD11blo cells in OT-II/RAG-1-/- and RAG-1-/- mice.

