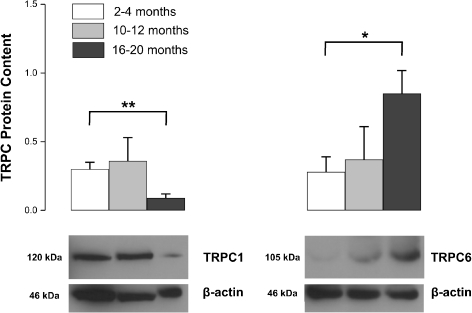
Fig. 2.
Western blot analysis of TRPC protein expression in 2–4-, 10–12- and 16–20-month-old rat aorta. Representative blot images for TRPC1 and TRPC6 proteins isolated from rat aorta were shown. β-actin protein was used as loading control. Protein levels were expressed as relative optical density. Shown are mean ± SEM; *P < 0.05; **P < 0.01, 2–4 months (open bars) vs. 16–20 months (closed bars), n = 5

