
Figure 1. Correlation plots for FRT-seq libraries.
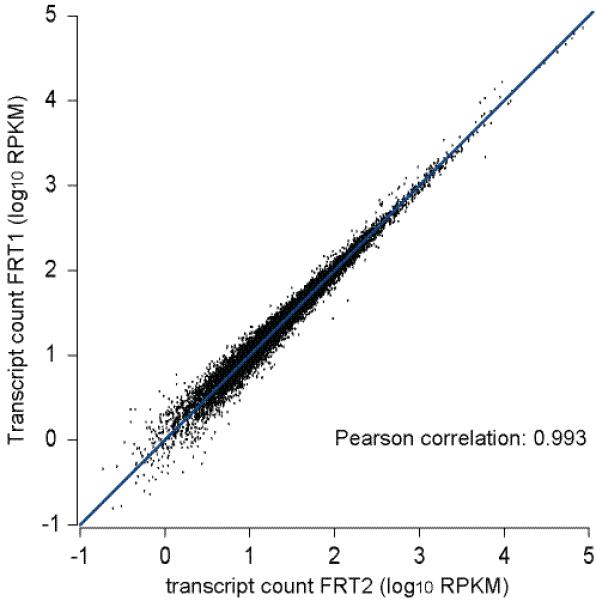
We plotted sequence data obtained from two FRT libraries prepared from the same poly A+ RNA sample. All reads were mapped to annotated genes from the ENSEMBL database, normalized read counts and calculated Pearson correlations between the libraries. RKPM = reads per kilobase of sequence per million reads.