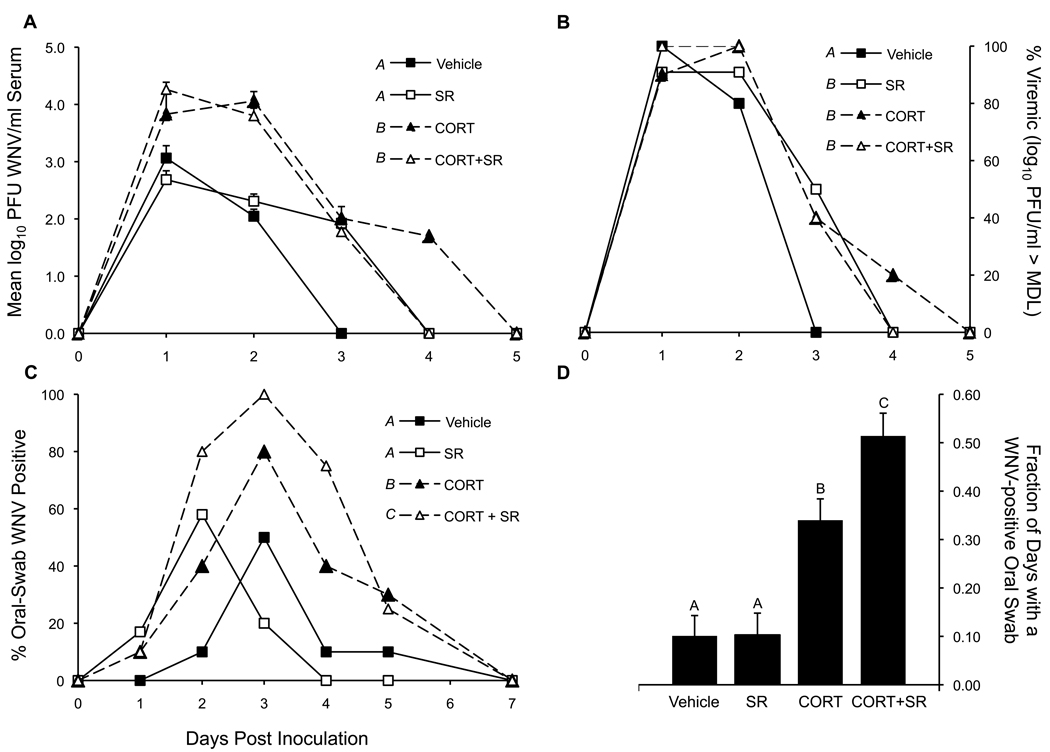
Figure 1. Viremia and oral shedding profiles.
(a) Mean ± SEM viremia for all subjects. Means presented as on the Y-axis in log10 PFU/ml when > minimum detection limit (MDL); or, as 0.00 log10 PFU/ml when < MDL (MDL for Vero cell plaque forming assay = 1.70 log10 PFU/ml). Viremia statistics summarize total viremia response curves. P < 0.0001. (b) Percent of chickens within a treatment group with a viremia greater than the MDL for the Vero cell plaque-forming assay (i.e., % positive for WN viremia within a treatment group). P < 0.05 between different letter superscripts for 3 DPI (c) Percent of chickens within a treatment group that were shedding oral virus on a given DPI. (d) Mean ± SEM fraction of days a chicken shed virus while it was alive from 1–5 DPI. P < 0.05 between different letter superscripts for panel c and d.

