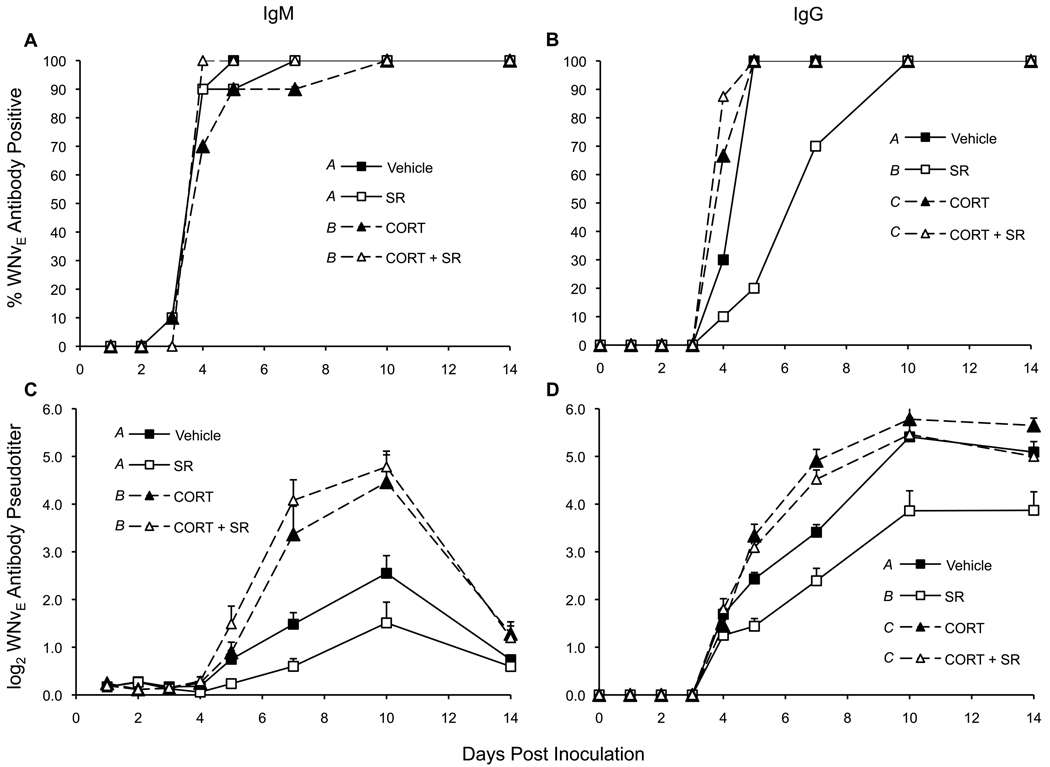
Figure 2. WNVEIgM and WNVEIgG profiles.
(a) IgM and (b) IgG were considered WNVE-antibody positive by ELISA when the OD of sample wells were > 2.0 times the OD of negative control wells. The mean ± SEM log2 pseudotiters of (c) IgM and (d) IgG were calculated by inserting a sample's OD into a dilution curve of WNVE-antibody positive chicken sera. P < 0.0001 between different letter superscripts.

