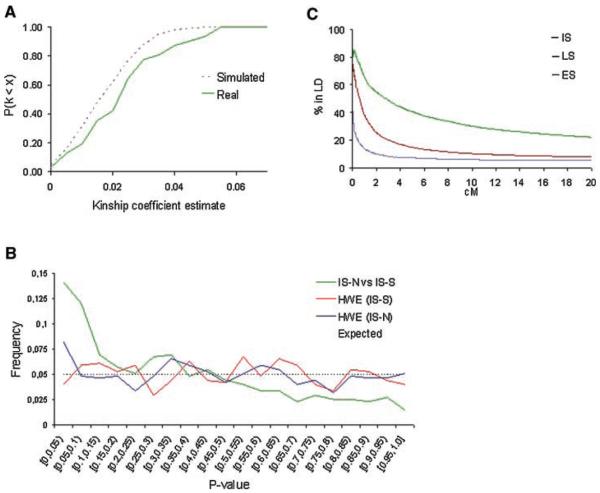
FIG. 2.
Genetic characteristics of the schizophrenia families from the internal isolate. A: Comparison of the observed and simulated Kinship Coefficients in 31 second cousins pairs. The probability of sharing alleles of genome-wide distributed microsatellite markers was estimated and the Kinship Coefficient was calculated. The observed Kinship Coefficients were 43% higher than expected. B: The distribution of alleles between the northern and southern subpopulations was tested by a likelihood ratio test and randomized P-value. The Hardy–Weinberg equilibrium values within the IS-S and IS-N samples were calculated using Fisher's exact test. P-values are shown on the x-axis and their frequency in the respective sample on the y-axis. A significant difference in the allele distribution existed (14% instead of the expected 5% at the 0.05). C: Linkage disequilibrium in chromosomes from the internal isolate, and the late and early settlement regions of Finland. The intermarker disequilibrium was measured between 212 microsatellite markers on chromosome 1q in families from Kuusamo (n=54), the late settlement (n=45), and the early settlement regions of Finland (n=16). The percentage of marker pairs rejecting the null hypothesis of linkage equilibrium (P<0.05) over different intervals is presented. The data reveal more LD in Kuusamo than the other samples, in agreement with its exceptional population history.

