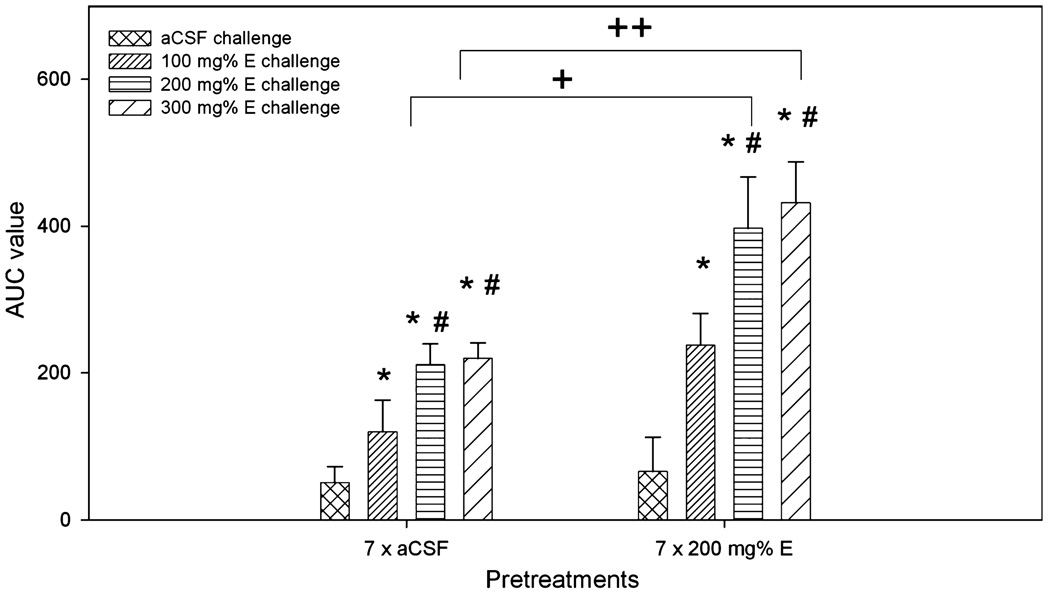
Fig. 4.
Area under the curve (AUC) analysis for the dose–response effect of different challenge doses of ethanol after 7 days of pretreatment with aCSF or 200 mg% ethanol. *p < 0.05, different from aCSF-challenged groups; #p < 0.05, different from both aCSF- and 100 mg% ethanol-challenged groups; +,++p < 0.05, difference between the aCSF- and ethanol-pretreated groups.

