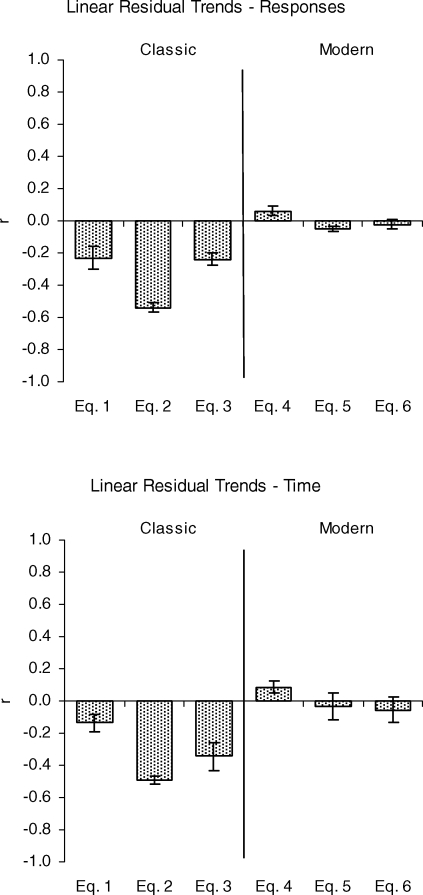
Fig 3.
Correlations of standardized residuals with response rates (top panel) and time allocations (bottom panel) predicted by the equations of classic (left portions) and modern (right portions) matching theory. Correlations not equal to zero indicate linear trends in the residuals. Error bars represent ± 1 standard error.

