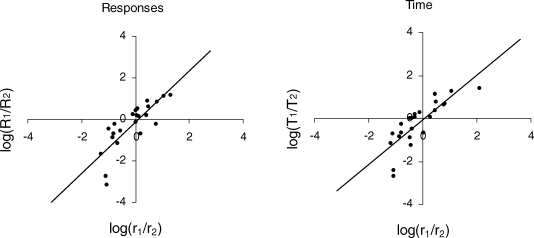
Fig 5.
Human between-subjects data sets constructed by random sampling from 24 within-subject data sets that showed little scatter around the best fits of Equation 4. The response rate and time allocation data shown are for the two constructed between-subjects data sets out of 20,000 that yielded the median %VAFs for fits of the log transform of Equation 4 (straight lines drawn through the plots). Evidently, the scatter in these plots is similar to that for plots of the boys' verbal response rates and time allocations (as shown, for example, in the left panels of Figure 2).

