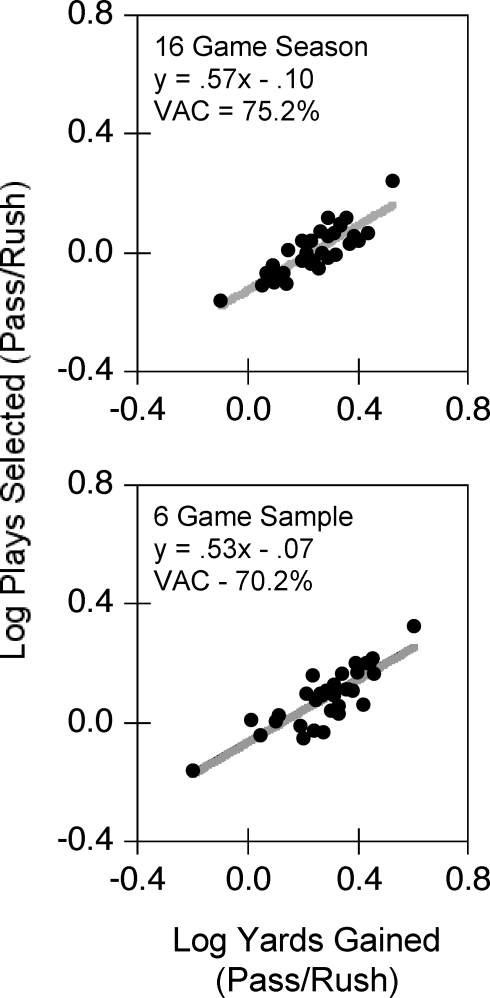
Fig 1.
Relationship between relative play frequency and relative yards gained through those plays, with both expressed as passing/rushing, for the 2006–2007 National Football League season. Each data point shows the season-aggregate data from one team. Shown in gray are lines of best fit as determined by applying the generalized matching equation (Equation 2) through least-squares linear regression. Top: Based on data from all 16 regular-season games. Bottom: Based on six randomly-selected games per team.

