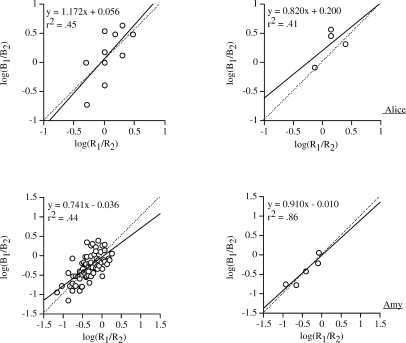
Fig 4.
Log response ratios plotted against log reinforcer ratios for Alice (top panels) and Amy (bottom panels) for problem behavior (B1) and appropriate behavior (B2). The linear equation depicts intercept and slope during all conditions of the escape assessment. Fits of Equation 1 and the coefficient of determination (r2) are shown in each panel. The panels in the left column show individual sessions, and panels in the right column show means across sessions.

