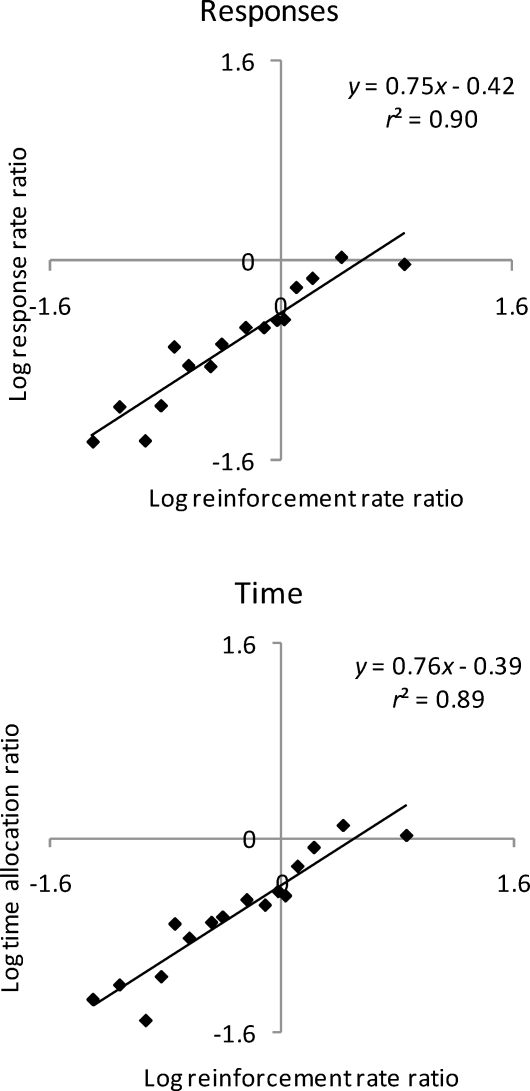
Fig 3.
Plots of the log transform of Equation 3 fitted to log response rate ratio (top panel) and log time ratio (bottom panel) data averaged within response rate ratio and time allocation ratio sedeciles. The best fitting equation and the proportion of variance it accounts for (r2) are given in each panel.

