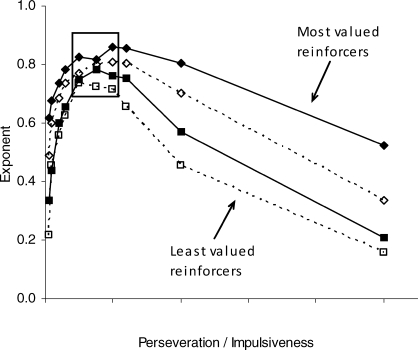
Fig 5.
Exponents, a, obtained from a selectionist computational theory of adaptive behavior dynamics at four levels of reinforcer value (represented by different symbols and line styles) and plotted as a function of degree of behavioral perseveration or impulsiveness. Exponents within the rectangle fall in a region where perseveration and impulsiveness may be adaptively balanced. To the left of the rectangle, behavior becomes perseverative; to the right it becomes impulsive. (Redrawn from McDowell & Popa, in press).

