
Table 2.
Cross-tabulations of frequency (expected frequency, Eij) of group membership in tobacco use trajectories and marijuana use trajectories
| Marijuana use |
|||||
| Tobacco use | Non/low user | Maturing out | Late onset | Chronic | Marginals |
| Non/low use | 257 (202.9)↑ | 14 (27.6) | 23 (41.7) | 11 (32.8) | 305 (64.21%) |
| Maturing out | 3 (4.0) | 0 (0.0) | 2 (0.8) | 1 (0.6) | 6 (1.26%) |
| Late onset | 44 (73.9) | 14 (10.5) | 30 (15.2)↑ | 23 (11.9) | 111 (23.37%) |
| Chronic | 12 (35.3) | 15 (4.8)↑ | 10 (7.3) | 16 (5.7)↑ | 53 (11.16%) |
| Marginals | 316 (66.53%) | 43 (9.05%) | 65 (13.68%) | 51 (10.74%) | 475 |
Note. χ2(9, n = 475) = 141.78, p < .0001; Φ = 0.55; Cramer’s V = 0.32. Numbers with up arrows (↑) indicate values that are significantly greater than would be expected under independence using the normal approximation to the binomial (p < .0001), that is, 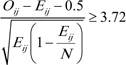 where Oij is the observed value of ith row and jth column and Eij is the expected value of ith row and jth column.