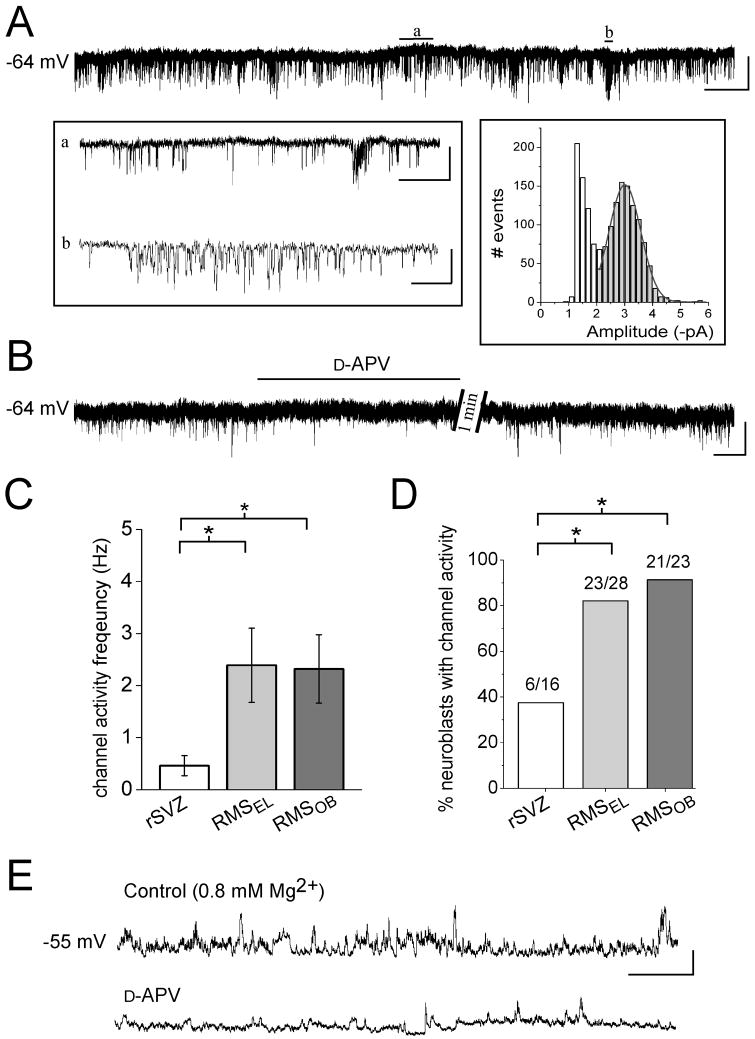
Figure 2. Most neuroblasts display phasic NMDAR activation by the time they reach the RMSEL.
(A) Perforated patch clamp records illustrating spontaneous single channel events (sSCEs) in a neuroblast of the RMSEL. Periods (a and b) are displayed on an expanded time-scale in the left inset. The right inset represents an amplitude histogram (bin size: 0.2 pA, 1617 events) for which part of the record is shown above. A Gaussian fit yielded a mean amplitude of −3.0 pA. Scale bars: 5 pA/4 s, 400 ms (a), 50 ms (b). (B) Perforated patch clamp records illustrating that sSCEs are sensitive to D-APV. Scale: 5 pA/30 s. (C) Bar graphs representing the frequency of single channels in rSVZ, RMSEL, and RMSOB neuroblasts (n=6, 17, and 20, respectively). The frequency significantly increased from the rSVZ to the RMSEL and to the RMSOB (p<0.05). (D) Bar graphs illustrating a significant increase in the percentage of neuroblasts displaying sSCEs from the rSVZ to the RMSEL (p<0.05). (E) Perforated patch clamp recordings in current clamp illustrating spontaneous depolarizations sensitive to D-APV in aCSF with near-physiological Mg2+ concentration (0.8 mM). Scale: 10 mV/3 s.

