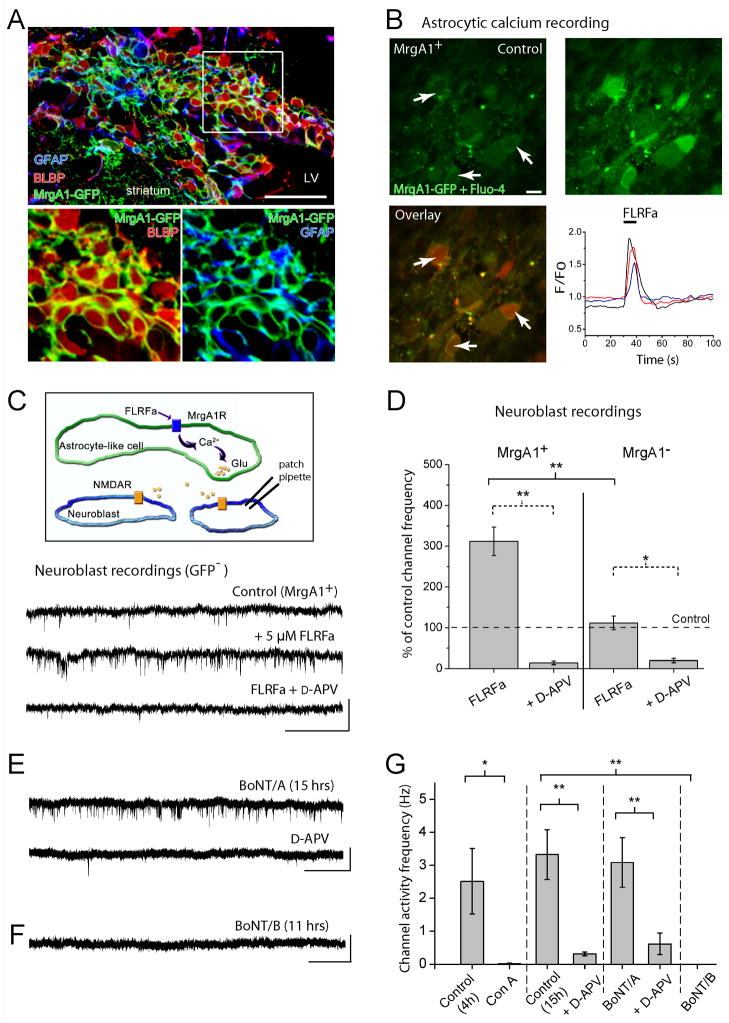
Figure 4. Ca2+-dependent vesicular glutamate release from RMS astrocytes contributes to NMDAR activation in neuroblasts.
(A) Confocal image displaying co-immunostaining for GFP in MrgA1+ mice (green), GFAP (blue), and BLBP (red) in the SVZ. The inset illustrates GFP/BLBP and GFP/GFAP staining from the image in the boxed region. Scale bars: 70 μm (top image)/40 μm. (B) Top: Confocal images of GFP- and Fluo-4-fluorescent cells in the RMS before (control) and during FLRFa pressure application (5 μM, 10 s). Recordings were performed in the RMS in acute sagittal slices from a MrgA1+ mouse. The arrow indicates astrocytes that are outlined by GFP fluorescence. Scale: 10 μm. Bottom: Overlay of the images under control (green) and during FLRFa application (red). On the right, activity graph illustrating Ca2+ increases in GFP+ cells, i.e. astrocytes. (C) Top: Model illustrating that FLRFa is applied to induce Ca2+ increases in astrocytes and examine whether NMDARs are activated in adjacent neuroblasts. Bottom: Perforated patch clamp records displaying sSCEs in neuroblasts under control and in the presence of FLRFa (5 μM, bath) followed by D-APV addition in slices from MrgA1+ mice. Scale bars: 5 pA/1 s. (D) Bar graphs illustrating the % increase of sSCE frequency in the presence of FLRFa without and with D-APV in MrgA1+ mice and control single transgenic mice (tetO-MrgA1, MrgA1−). The asterisks indicate significant enhancement above control levels of 100% (*, p<0.05; **, p<0.01). (E) Perforated patch clamp records displaying spontaneous SCEs in neuroblasts after 15 hrs pre-incubation in BoNT/A and after addition of D-APV. Scale: 5 pA/3 s. (F) Perforated patch clamp records displaying the lack of spontaneous SCEs in neuroblasts after 11 hrs pre-incubation in BoNT/B. Application of NMDA still induced inward currents. Scale: 5 pA/4 s. (G) Bar graphs illustrating the frequency of spontaneous SCEs following pre-incubation in control aCSF (for 4 hrs or 11–15 hrs) or BoNT/A, and the absence of SCEs following pre-incubation in Con A or BoNT/B. (** p<0.01, * p<0.05).

